One of the things I enjoy is when people reach out with suggestions for blogs and projects that would help them. A recent suggestion was about working with the XADC and using it as a simple oscilloscope. They wanted the samples to be captured and then post-processed on a host computer.
This got me thinking about how to accomplish such a task. In fact, I created a couple of Hackster projects a few years ago that explored something similar. The first project uses a Basys 3 to plot values on a screen (it’s pretty rudimentary), while the second project stores XADC data in a CSV file for later processing.
However, this sparked another idea: using the FTDI USB UART to share the XADC data. This method can send data at up to 921600 baud if we use a virtual COM port on a Windows machine.

The XADC can be configured to output sample data over an AXI Stream. For a single channel, such as the Vp/Vn input, the output is 16 bits, where the upper 12 bits represent the ADC conversion and the lower 4 bits can be used for averaging and noise reduction.
Since the output is 16-bit, using a UART requires sending 2 bytes for each sample. At a standard data rate of 115200 baud, this would significantly limit the sampling rate because it would take 22 bit times to transmit both bytes [16 data bits, 2 parity, 2 start, and 2 stop bits]. This means that the maximum data rate from the XADC would be 115200 / 22, or 5236 samples per second.
With such a low rate, this is only useful for niche applications. However, if we use a baud rate of 921600, the maximum supported by Windows, we could achieve around 40,000 samples per second. Note that this UART has very small tracks on the PCB before it is input into an FTDI to become a virtual USB UART.
At this sampling rate, things become interesting, as the Vp/Vn pair supports up to 1 MSps in UltraScale and UltraScale+ systems, which use the system monitor at 100 Ksps.
With this in mind, I decided to continue the experiment and wrote a simple AXI Streaming UART that transmits the 16-bit sample using two bytes. The AXIS UART and completed project is available on my GitHub.
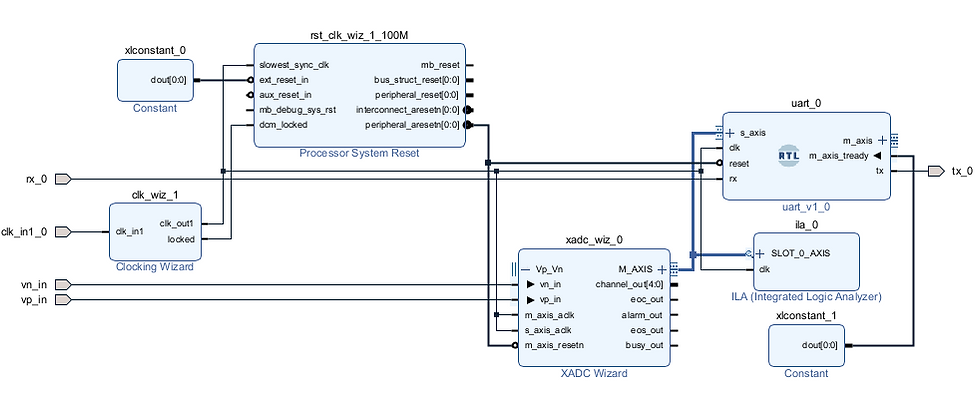
The project design is straightforward: we configure the XADC to output samples on the AXI Stream and remove configurability and alarms to keep the solution simple. The only additional step is to add a custom UART and connect the design. I also included an ILA to monitor streaming values to verify the values received in the application program.

The XADC Configuration is
The application developed to receive this data is straightforward in Python. We open the port at the desired baud rate, read in both bytes, and create a complete 12-bit value. Once we have this value, we can plot the levels received.
import serial
import struct
import matplotlib.pyplot as plt

# Configure the serial connection settings
com_port = "COM18"  # Change this to the appropriate COM port
baud_rate = 921600   # Set the baud rate
timeout = 1        # Set the timeout in seconds
parity = serial.PARITY_ODD  # Set parity to odd


# Initialize serial connection
ser = serial.Serial(com_port, baud_rate, timeout=timeout, parity=parity)

def read_and_convert():
    try:
        # Read a byte from the COM port
        raw_data = ser.read(2)

        if raw_data:
            upper_byte, lower_byte = struct.unpack('BB', raw_data)
            combined_int = (upper_byte << 8) | lower_byte
            combined_int = combined_int >> 4 #format for 12 bits
            return combined_int
        else:
            return None
    except Exception as e:
        print(f"Error: {e}")
        return None

try:
    # Read 100 samples from the COM port
    samples_to_read = 100
    results = []

    for _ in range(samples_to_read):
        result = read_and_convert()
        if result is not None:
            results.append(result)
            #print(f"Received signed 8-bit number: {result}")
        else:
            print("No data received.")

    # Print all received data
    print("All received data:", results)
        # Plotting the results
    plt.figure(figsize=(10, 5))
    plt.plot(results, marker='o', linestyle='-', color='b')
    plt.title('Received Unsigned Values')
    plt.xlabel('Sample Index')
    plt.ylabel('Unsigned Value')
    plt.grid(True)
    plt.show()


finally:
    # Close the serial connection
    ser.close()
    print("Serial port closed.")
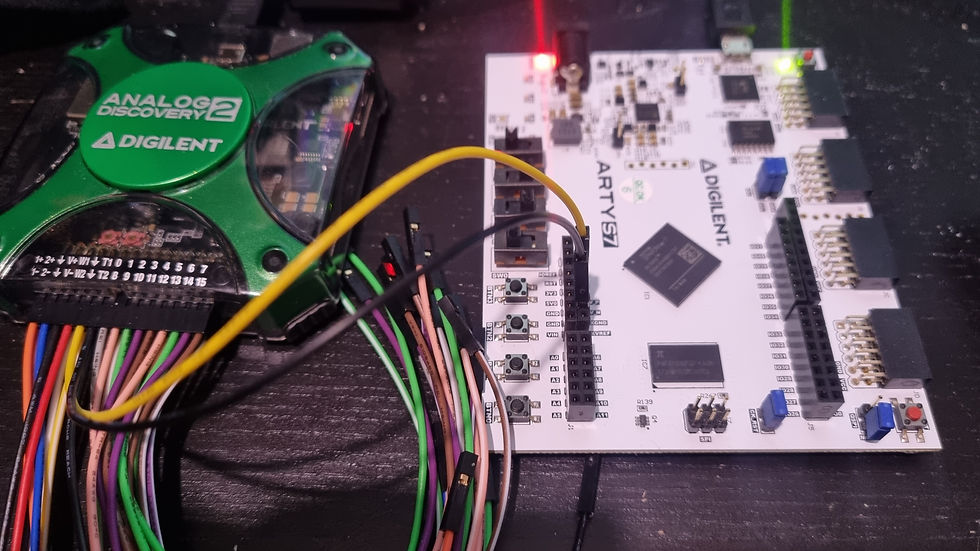
To generate a signal, I used an Analog Discovery 2 as the input stimulus for the XADC. Since the XADC was configured in unipolar mode, the input voltage range is between 0 and 1V.
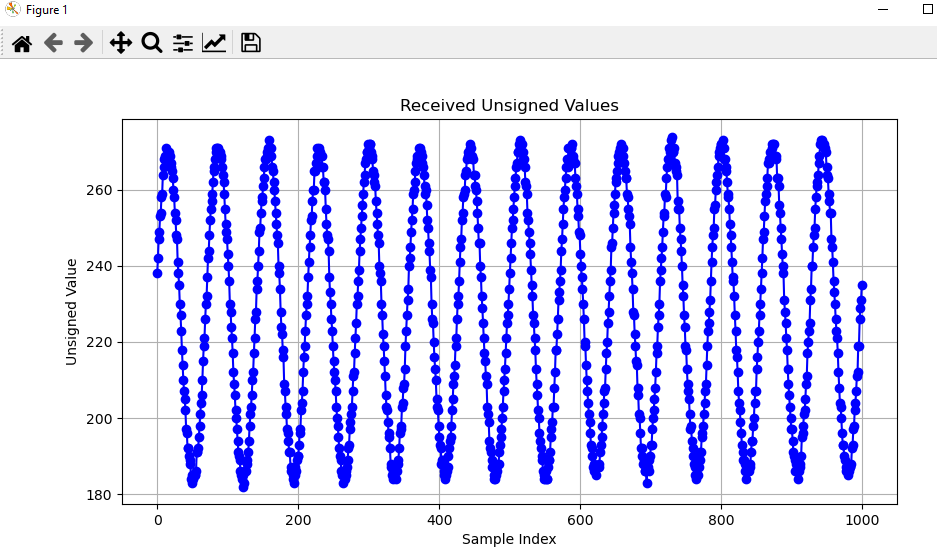
Running the script works as expected and plots the waveform generated by the AD2.


Hopefully, this blog and the links to previous projects will help you when considering how to work with the XADC / Sysmon.
As always, please keep the suggestions and recommendations coming!
Workshops and Webinars
If you enjoyed the blog why not take a look at the free webinars, workshops and training courses we have created over the years. Highlights include
Upcoming Webinars Timing, RTL Creation, FPGA Math and Mixed Signal
Professional PYNQ Learn how to use PYNQ in your developments
Introduction to Vivado learn how to use AMD Vivado
Ultra96, MiniZed & ZU1 three day course looking at HW, SW and PetaLinux
Arty Z7-20 Class looking at HW, SW and PetaLinux
Mastering MicroBlaze learn how to create MicroBlaze solutions
HLS Hero Workshop learn how to create High Level Synthesis based solutions
Perfecting Petalinux learn how to create and work with PetaLinux OS
Boards
Get an Adiuvo development board
Adiuvo Spartan 7 / RPi 2040 Embedded System Development Board
Adiuvo Spartan 7 Tile - Low Risk way to add a FPGA to your design.
Embedded System Book
Do you want to know more about designing embedded systems from scratch? Check out our book on creating embedded systems. This book will walk you through all the stages of requirements, architecture, component selection, schematics, layout, and FPGA / software design. We designed and manufactured the board at the heart of the book! The schematics and layout are available in Altium here Learn more about the board (see previous blogs on Bring up, DDR validation, USB, Sensors) and view the schematics here.


Comments